What did the Edmonton & Area real estate market do in September 2026?

September did what September usually does. Families got back into the school routine and fewer people were out shopping for homes.
What stood out this year is that sellers kept listing. The gap between homes coming on the market and homes selling is the real story this month. Here is what it means for you.
What were the key numbers in September 2026?
Greater Edmonton Area, September 2026
What changed in the Edmonton market this month?
Sales slowed again. Home sales have dropped every month since June. That is normal for fall. What is less normal is how much supply is building up at the same time.
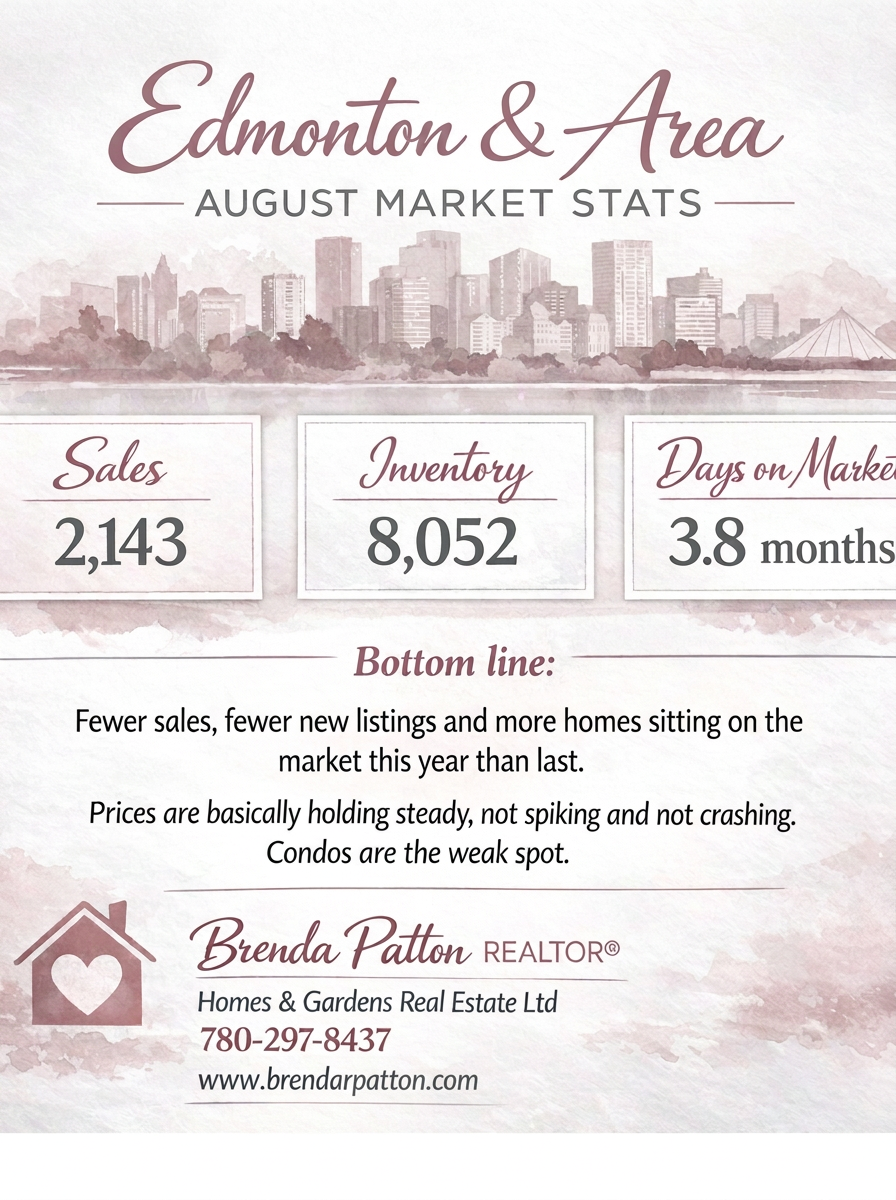
Listings kept coming. New listings rose 7.2% from August while sales fell 8.8%. There are now 8,062 homes for sale across the Greater Edmonton Area. That is the most for a September in at least five years. At September's pace of sales it works out to about four months of supply. In July it was closer to three.
Prices are holding, not falling. The average price of $466,080 is still 2.9% higher than a year ago. The median sits at $435,000, exactly where it was last September. The benchmark price tracks a typical home. It dipped 0.9% from August and is now just under last year's level.
Homes are taking longer to sell. The average home sat for 44 days. That is five days longer than last September. Sellers are still getting close to their price though. On average homes sold for about 98% of list price.
The REALTORS® Association of Edmonton expects sales to stay quiet until after the new year. The Association also noted that rising inventory could slow price growth even more.
How did each property type perform?
| Type | Average price | vs. last year | Avg. days on market |
|---|---|---|---|
| Detached | $569,820 | Up 2.9% | 42 |
| Semi-detached | $412,974 | Down 4.8% | 43 |
| Row/townhouse | $289,640 | Down 4.5% | 45 |
| Apartment condo | $208,672 | Up 0.6% | 50 |
Detached homes are holding up best. Semi-detached homes and townhomes saw the biggest price drops from last year. Townhouse sales were also down 20.1% from last September. Condos are steady on price but take the longest to sell.
How did Sherwood Park, Beaumont and Leduc do?
September 2026 compared with September 2025
| Area | Sales | Average price | vs. last year |
|---|---|---|---|
| Sherwood Park (detached) | 79 | $595,120 | Up 2.9% |
| Beaumont (all residential) | 33 | $546,989 | Down 3.4% |
| Leduc (detached) | 48 | $481,631 | Down 1.1% |
Detached homes in Sherwood Park are still gaining value. Beaumont and Leduc dipped slightly on price. Leduc also had fewer detached sales than last September (48 compared with 61). Smaller communities swing more from month to month. Look at the trend over a few months before reading too much into one.
What does this mean if you are buying?
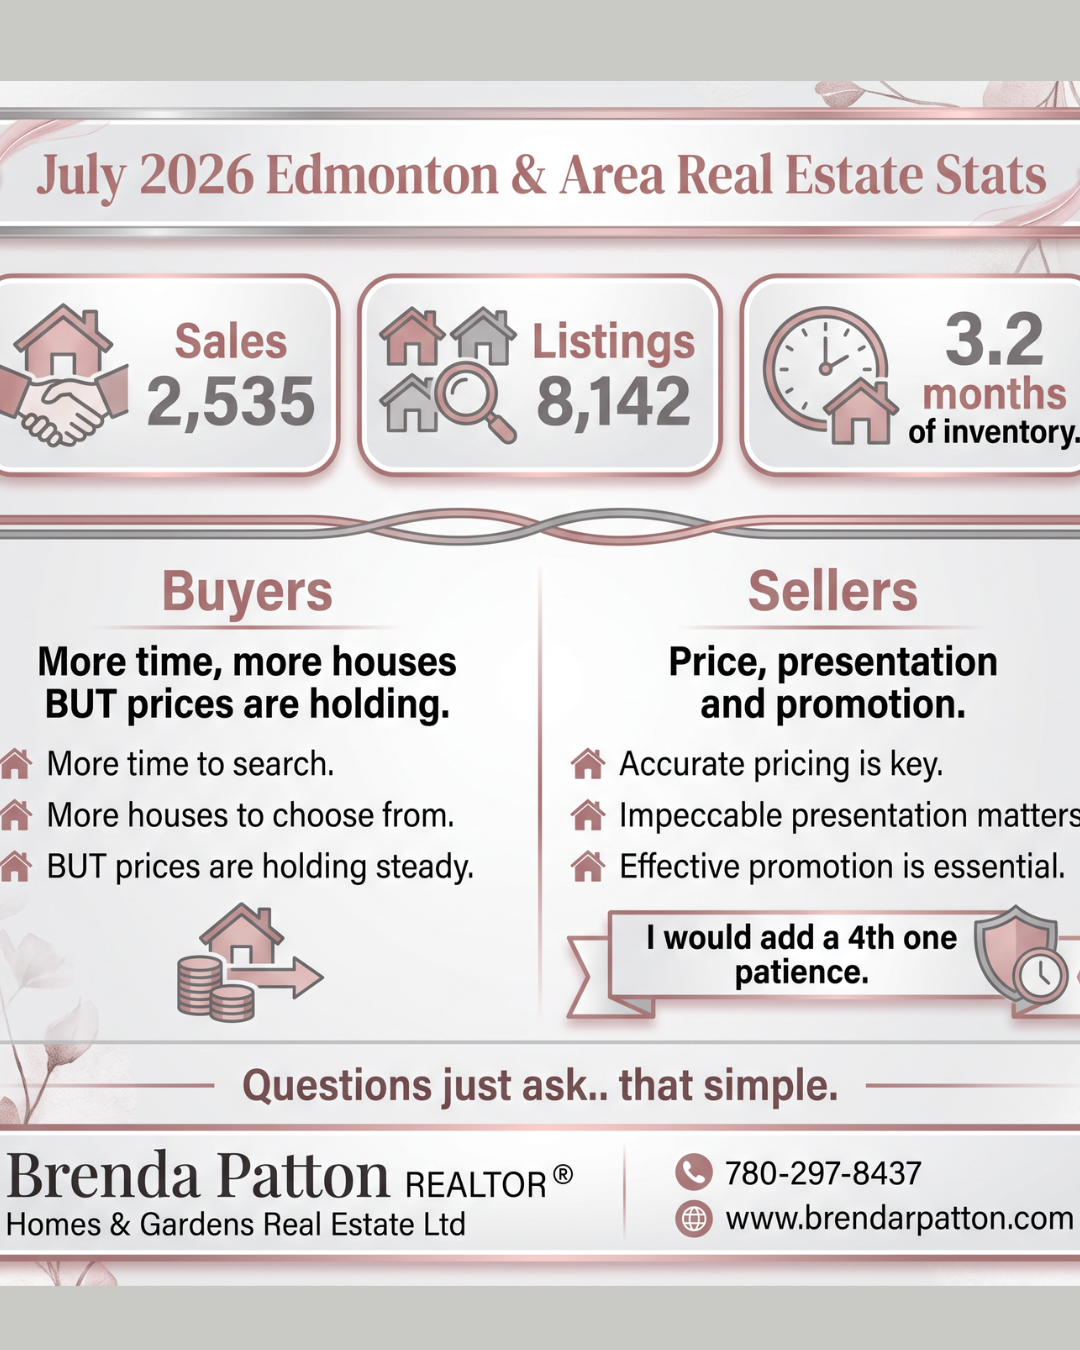
- You have more choice. With over 8,000 homes for sale you can compare a few options before you decide.
- You have more time. Homes are sitting an average of 44 days. You can take a day to think it over.
- Keep your conditions. Financing and inspection conditions are easier to keep in a market like this. They protect you.
- Do not expect deep discounts. Homes are still selling for about 98% of asking. There is room to negotiate but it is modest.
- Look at semi-detached homes and townhomes. This is where prices have softened most. For many first-time buyers it is also the most realistic way into ownership.
What does this mean if you are selling?
- Price it right from day one. Buyers have options and they are comparing. The longer a home sits the more buyers wonder why.
- Presentation matters more now. A clean, bright and well-photographed home stands out when buyers are scrolling past 8,000 others.
- Plan for a longer timeline. Six weeks is a fair expectation right now.
- Buying and selling at the same time? A slower market works both ways. What you give up on your sale you may be able to make up on your purchase.
What is the bottom line?
Edmonton is in its usual fall slowdown with more homes for sale than we have seen in years. Prices are holding steady overall. For buyers that means choice and time. For sellers it means pricing and presentation carry more weight than they did in the spring.
Every neighbourhood moves a little differently. If you want to know what these numbers mean for your street or your home, I am happy to walk you through it your free 15 - minute call booking page.
Brenda Patton, REALTOR®
Homes & Gardens Real Estate Limited
780-297-8437 | brendarpatton.com
Source: REALTORS® Association of Edmonton, September 2026 Monthly Market Statistics, released October 2, 2026. Figures are for the Greater Edmonton Area unless noted. Averages show market trends and do not reflect the value of any specific home.